The Revised FBI Crime Data Reveals that it Originally Missed 1,699 Murders in 2022. Given that Almost all Murders are Reported, How Does the FBI Miss that Many Murders?
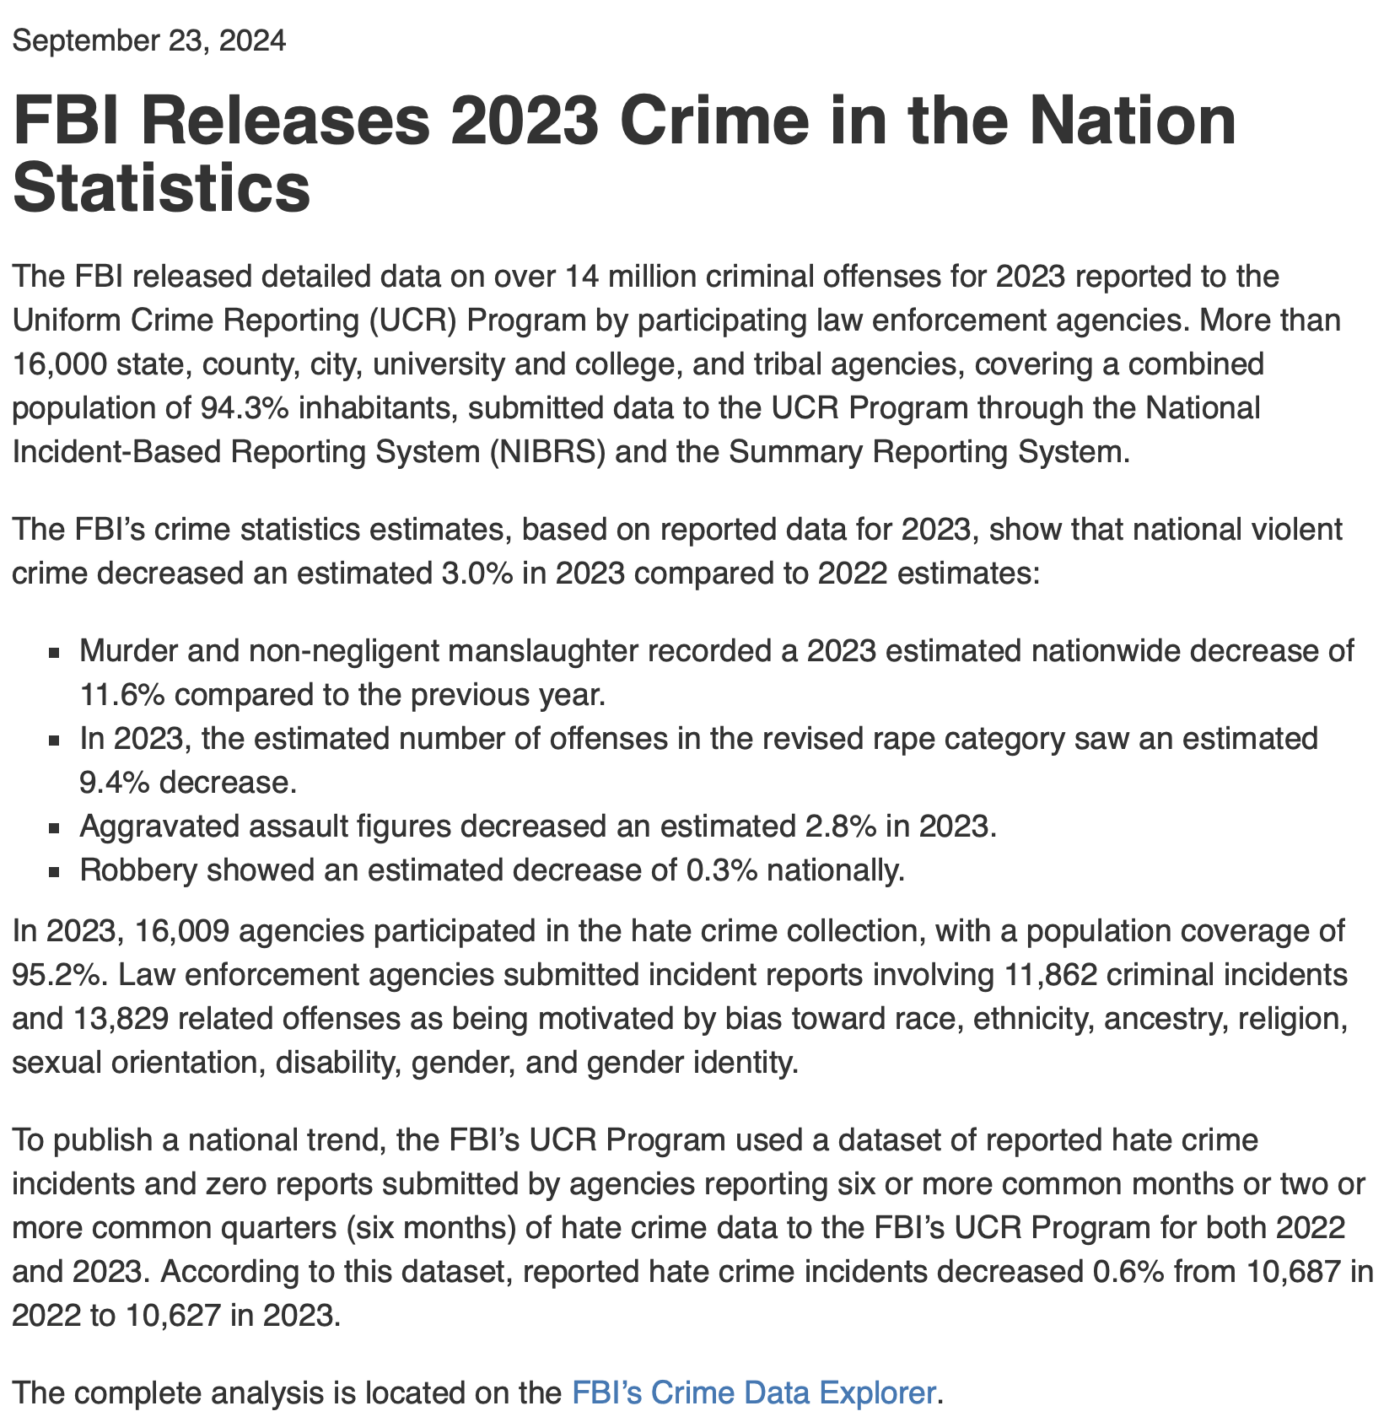
USA Today’s headline on the FBI’s reported crime data released in September 2023 claims “Violent crime dropped for second straight year in 2023, including murder and rape.” There are two errors in their headline. First, that it is the FBI’s measure of reported crime that fell, but that is not the same as all crime nor is it the only measure of reported crime. So they could have written, the FBI’s measure of reported violent crime fell in 2023. The second error is that they are wrong claiming that this was the second straight year, where an adjustment in the data showed a 4.5% increase in 2022. Originally, the FBI said that violent crime had fallen by 2.1% and now they say it increased by 4.5%. Just like the Bureau of Labor Statistics overestimated the number of jobs created.
Presumably the media was just reading the FBI’s press release and not looking at the actual data, and that may be why the media has ignored these statistics. Shockingly, the FBI’s September press release with the 2023 data doesn’t mention the changes to earlier data and that the original drop in violent crime for 2022 was now an increase. Nor did they mention that the new reported increase in 2022 was larger than the claimed decrease in 2023.
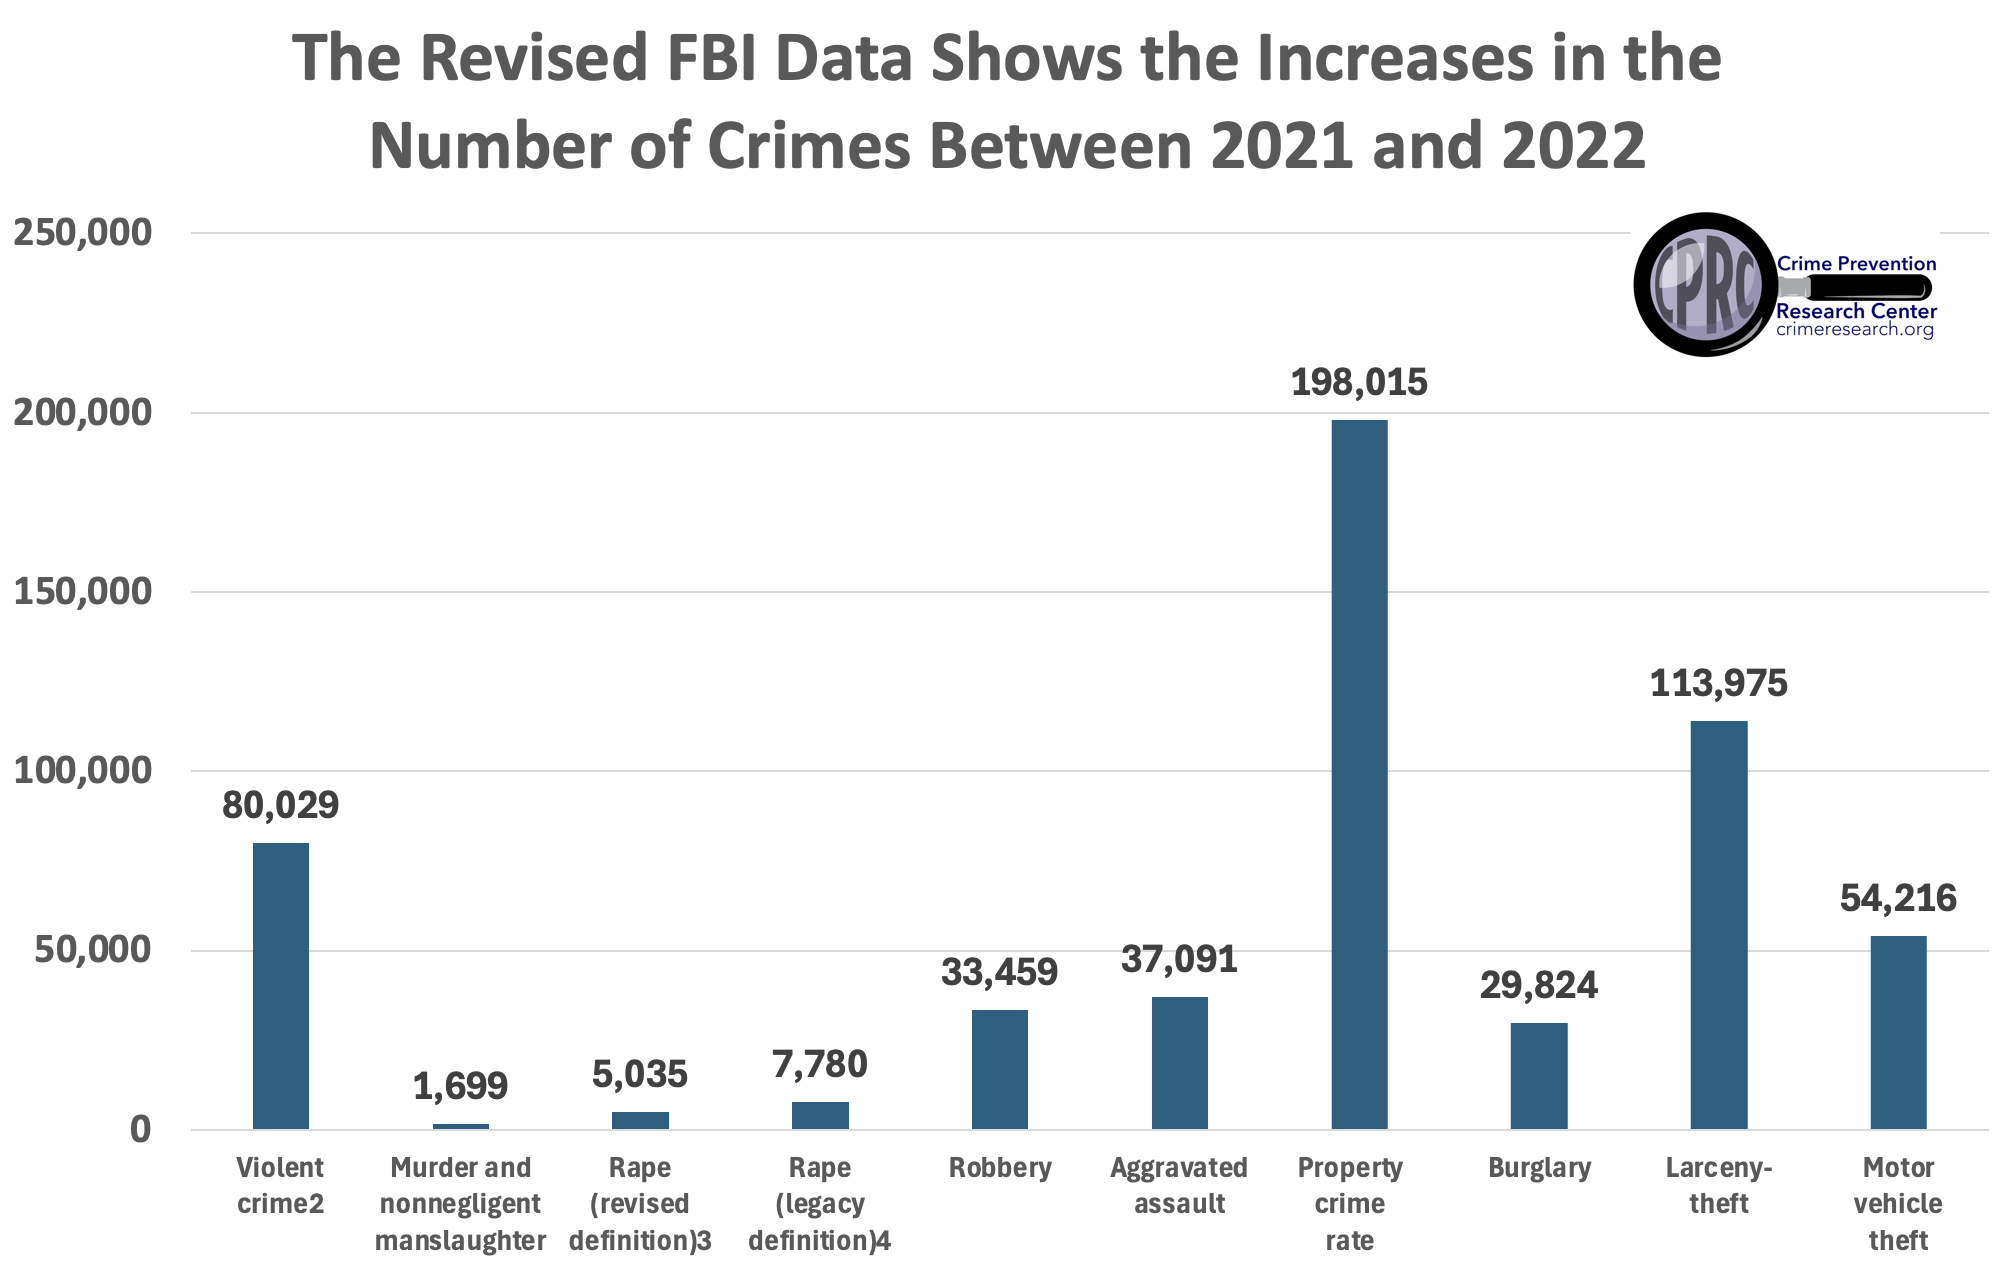
With the adjustments, compared to the new adjusted data for 2021, there is a net increase of 80.029 more violent crimes, 1,699 more murders, 7,780 more rapes, 33,459 more robberies, and 37,091 more aggravated assaults.
A major weakness for reported crime data is that most crimes aren’t reported to the police. Murder has the advantage because the vast majority of murders are reported. But the revised data for 2021 and 2022 shows a net increase of 1,699 more murders. How do you miss 1,699 murders? Another crime category that is well reported is motor vehicle theft because the thefts have to be reported for insurance to cover the theft. But the revised data shows a net increase of 54,216 more motor vehicle thefts.
The newly released FBI data is available here. The original 2022 FBI data is available here for comparison.
| FBI Reported Crime Data for 2021 and 2022 that was originally released in September 2023 and then revised in September 2024 | ||||||||||
| Original data released in September 2023 | Violent crime | Murder and nonnegligent manslaughter | Rape (revised definition) | Rape (legacy definition) | Robbery | Aggravated assault | Property crime | Burglary | Larceny- theft | Motor vehicle theft |
| 2021 | 1,253,716 | 22,536 | 140,902 | 109,733 | 217,550 | 903,897 | 6,083,874 | 899369 | 4334764 | 849741 |
| 2022 | 1,232,428 | 21,156 | 133,294 | 96,842 | 220,450 | 893,980 | 6,513,829 | 899293 | 4672363 | 942173 |
| Original Change | -21,288 | -1,380 | -7,608 | -12,891 | 2,900 | -9,917 | 429,955 | -76 | 337,599 | 92,432 |
| Revised data released in September 2024 | ||||||||||
| 2021 | 1,197,930 | 21,462 | 142,957 | 106,561 | 187,152 | 882,755 | 5,950,311 | 879,152 | 4,269,688 | 801,471 |
| 2022 | 1,256,671 | 21,781 | 140,384 | 101,450 | 223,511 | 909,929 | 6,578,281 | 908,900 | 4,721,262 | 948,119 |
| Revised Change | 58,741 | 319 | -2,573 | -5,111 | 36,359 | 27,174 | 627,970 | 29,748 | 451,574 | 146,648 |
| Total Change | 80,029 | 1,699 | 5,035 | 7,780 | 33,459 | 37,091 | 198,015 | 29,824 | 113,975 | 54,216 |
Another way of looking at these numbers is that the FBI overcounted the number of murders in 2021 by 1,074 and undercounted the number in 2022 by 625, again a gap of 1,699. Similarly, the FBI overcounted the number of violent reported violent crimes in 2021 by 55,786 and undercounted the number in 2022 by 24,243, again a gap of 80,029.
The percent changes in the various crime rates are dramatic.
| FBI Reported Crime Rate Data for 2021 and 2022 that was originally released in September 2023 and then revised in September 2024 | ||||||||||
| Violent crime rate | Murder and nonnegligent manslaughter rate | Rape (revised definition) rate3 | Rape (legacy definition) rate4 | Robbery rate | Aggravated assault rate | Property crime rate | Burglary rate | Larceny- theft rate | Motor vehicle theft rate | |
| Original data released in September 2023 | ||||||||||
| 2021 | 377.6 | 6.8 | 42.4 | 33.0 | 65.5 | 272.2 | 1,832.3 | 270.9 | 1,305.5 | 255.9 |
| 2022 | 369.8 | 6.3 | 40.0 | 29.1 | 66.1 | 268.2 | 1,954.4 | 269.8 | 1,401.9 | 282.7 |
| Revised data released in September 2024 | ||||||||||
| 2021 | 360.9 | 6.5 | 43.1 | 32.1 | 56.4 | 266.0 | 1,792.8 | 264.9 | 1,286.5 | 241.5 |
| 2022 | 377.1 | 6.5 | 42.1 | 30.4 | 67.1 | 273.0 | 1,973.8 | 272.7 | 1,416.6 | 284.5 |
| Original Percentage Change in Rate | -2.1% | -7.4% | -5.7% | -11.8% | 0.9% | -1.5% | 6.7% | -0.4% | 7.4% | 10.5% |
| New Percentage Change in rate | 4.5% | 0.0% | -2.3% | -5.3% | 19.0% | 2.6% | 10.1% | 2.9% | 10.1% | 17.8% |
| Difference | 6.6% | 7.4% | 3.3% | 6.5% | 18.1% | 4.1% | 3.4% | 3.4% | 2.7% | 7.3% |


No comments:
Post a Comment