Limitations
The estimates of the cumulative burden of seasonal influenza are subject to several limitations.
First, the cumulative rate of laboratory-confirmed influenza-associated hospitalizations reported during the season may be an under-estimate of the rate at the end of the season because of identification and reporting delays.
Second, rates of laboratory-confirmed influenza-associated hospitalizations were adjusted for the frequency of influenza testing and the sensitivity of influenza diagnostic assays. However, data on testing practices during the 2019-2020 season are not available in real-time. CDC used data on testing practices from the past influenza seasons as a proxy. Burden estimates will be updated at a later date when data on contemporary testing practices become available.
Third, estimates of influenza-associated illness and medical visits are based on data from prior seasons, which may not be accurate if the seriousness of illness or patterns of care-seeking have changed.
Frequently Asked Questions
What does the cumulative burden of influenza for the 2019-2020 season mean?
The cumulative burden of influenza is an estimate of the number of people who have been sick, seen a healthcare provider, been hospitalized, or died as a result of influenza since October 01, 2018. CDC does not know the exact number of people who have been sick and affected by influenza because influenza is not a reportable disease in most areas of the United States. However, these numbers are estimated using a mathematical model, based on observed rates of laboratory-confirmed
influenza-associated hospitalizations.
How does CDC estimate the cumulative burden of seasonal influenza?
Preliminary estimates of the cumulative burden of seasonal influenza during the 2019-2020 season in the United States are based on crude rates of laboratory-confirmed influenza-associated hospitalizations, reported through the
Influenza Hospitalization Surveillance Network (FluSurv-NET), which were adjusted for the frequency of influenza testing during recent prior seasons and the sensitivity of influenza diagnostic assays. Rates of hospitalization were then multiplied by previously estimated ratio of hospitalizations to symptomatic illnesses, and frequency of seeking medical care to calculate symptomatic illnesses, medical visits, and deaths associated with seasonal influenza, respectively.
Why does the estimate of cumulative burden change each week?
The estimates of cumulative burden of seasonal influenza are considered preliminary and may change each week as new laboratory-confirmed influenza-associated hospitalizations are reported to CDC. New reports include both new admissions that have occurred during the reporting week and also patients admitted in previous weeks that have been newly reported to CDC.
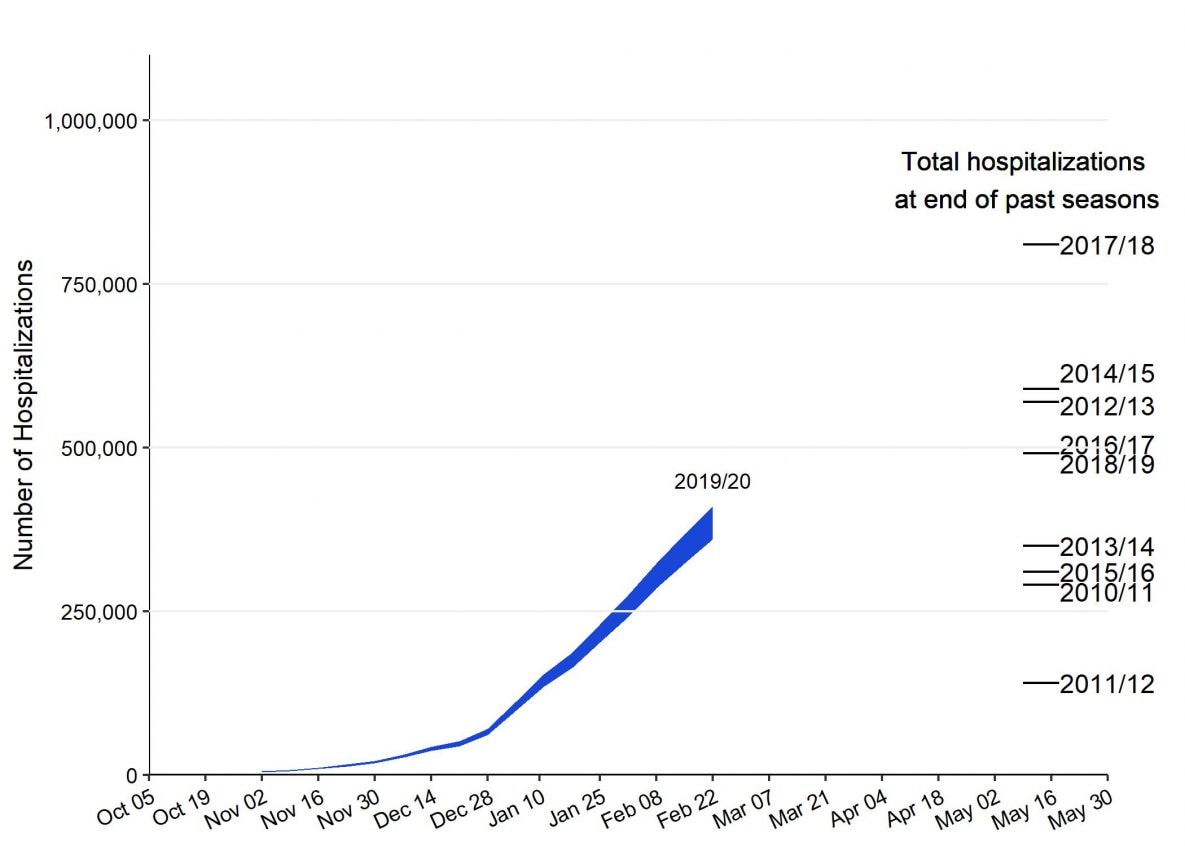
How does the number of flu hospitalizations estimated so far this season compare with previous end-of-season hospitalization estimates?
The number of hospitalizations estimated so far this season is lower than end-of-season total hospitalization estimates for any season since CDC began making these estimates. This
table also summarizes all estimated influenza disease burden, by season, in U.S. from 2010-11 through 2017-18.


No comments:
Post a Comment