
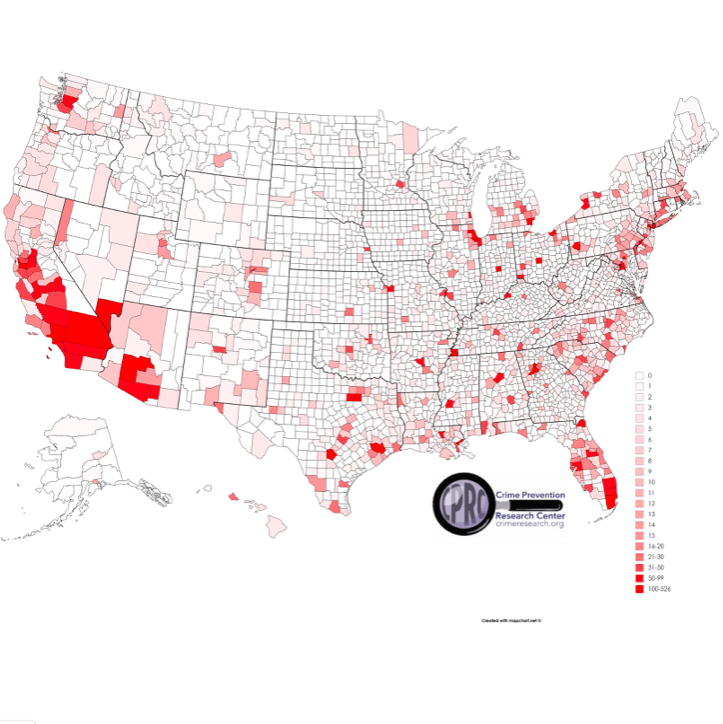
You can examine the picture of the US counties in more detail by opening it in a new tab.
The Distribution of murders
The United States can really be divided up into three types of places. Places where there are no murders, places where there are a few murders, and places where murders are very common.
In 2014, the most recent year that a county-level breakdown is available, 54% of counties (with 11% of the population) have no murders. 69% of counties have no more than one murder, and about 20% of the population. These counties account for only 4% of all murders in the country.
The worst 1% of counties have 19% of the population and 37% of the murders. The worst 2% of counties contain 28% of the population and 51% of the murders. The worst 5% of counties contain 47% of the population and account for 68% of murders. But even within those counties the murders are very heavily concentrated in small areas.
Murders actually used to be even more concentrated. From 1977 to 2000, on average 73 percent of counties in any given year had zero murders. Possibly, this change is a result of the opioid epidemic’s spread to more rural areas. But that question is beyond the scope of this study. Lott’s book “More Guns, Less Crime” showed how dramatically counties within states vary dramatically with respect to murder and other violent crime rates.

Breaking down the most dangerous counties in Figure 2 shows over half the murders occur in just 2% of the counties, 37% in just the worst 1% of the counties.
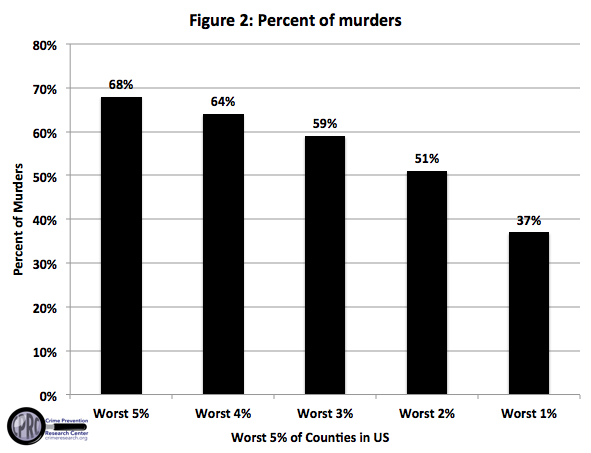
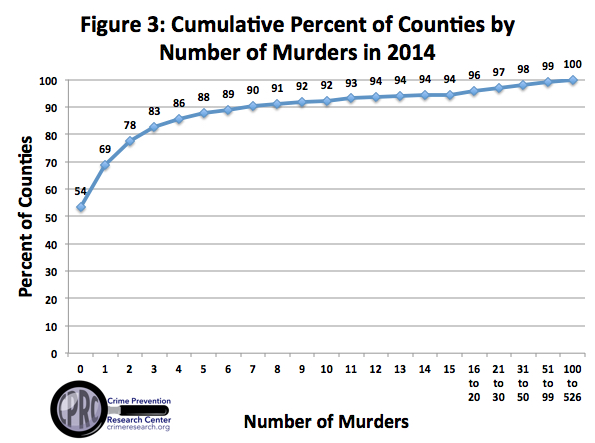
Figure 1 illustrates how few counties have a significant number of murders. Figure 3 further illustrates that with a cumulative perspective. 54% of counties have zero murders, 69% have at most one murder, 76% have at most two murders, and so on. To put it differently, only the top four percent of the counties have 16 or more murders.
In 2014, the murder rate was 4.4 per 100,000 people. If the 1% of the counties with the worst number of murders somehow were to become a separate country, the murder rate in the rest of the US would have been only 3.4 in 2014. Removing the worst 2% or 5% would have reduced the US rate to just 3.06 or 2.56 per 100,000, respectively.
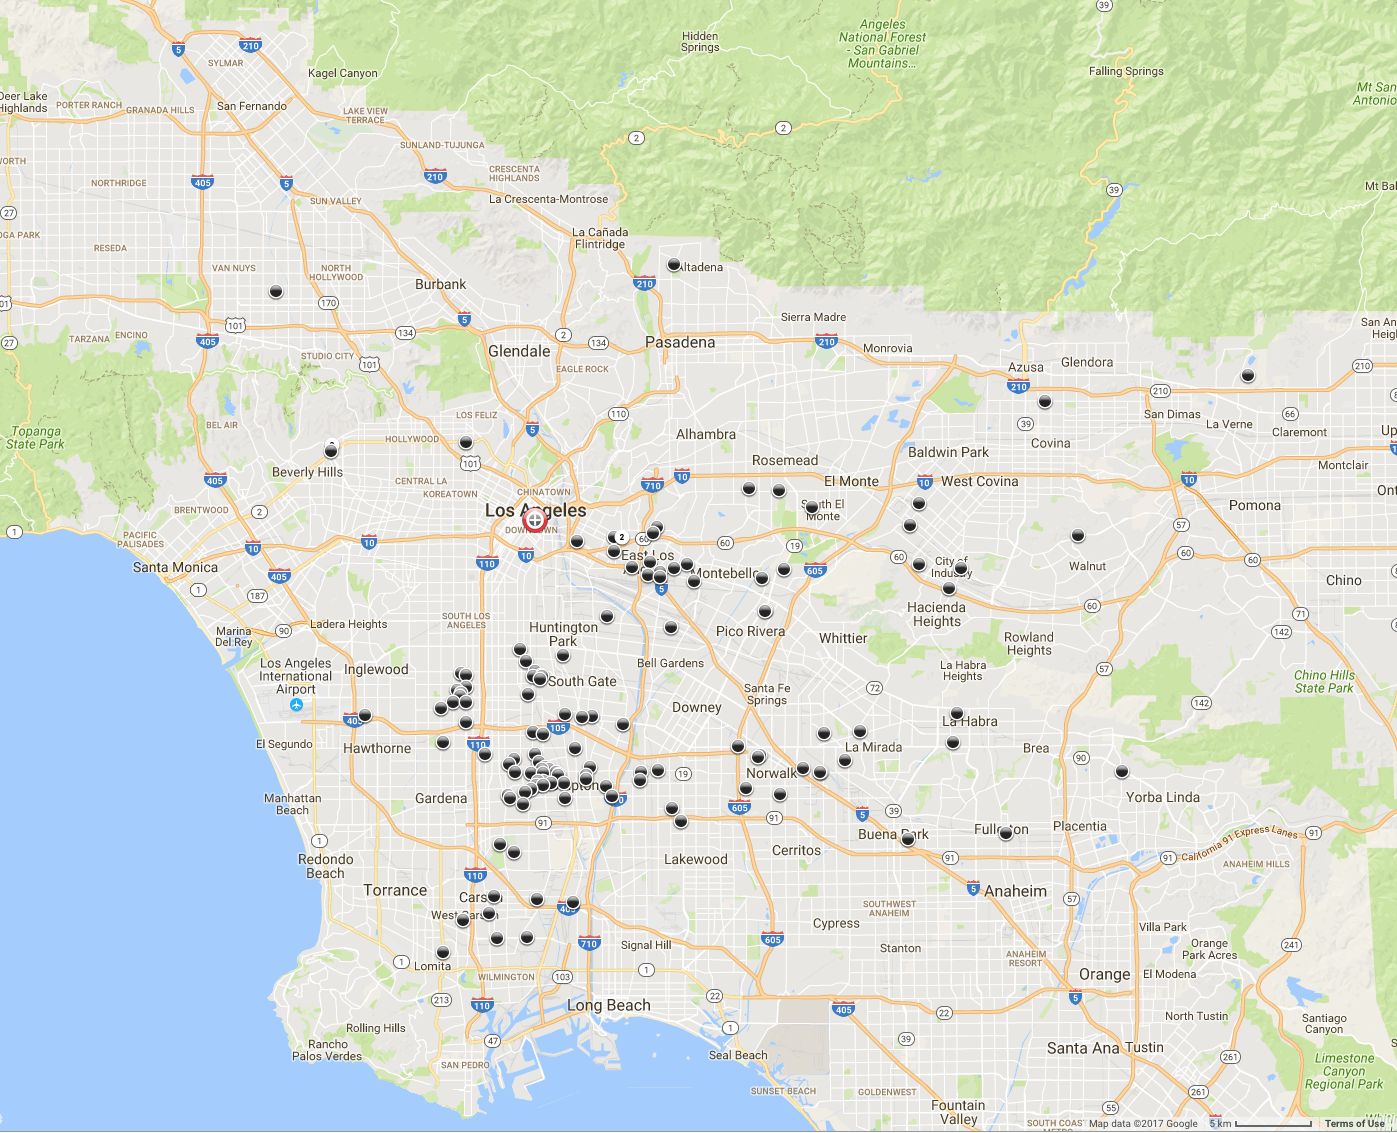
Even within the Counties with the murders, the murders are heavily Concentrated within those counties
When you look at individual counties with a high number of murders, you find large areas with few murders. Take Los Angeles County, with 526 murders in 2014, the most of any county in the US. The county has virtually no murders in the northwestern part of the county. There was only one murder each in Beverly Hills, Hawthorne, and Van Nuys. Clearly, different parts of the county face very different risks of murder.
The map below shows the distribution of murders in Indianapolis, with 135 murders. Although the city extends well beyond the 465 Highway that encircles downtown Indianapolis, there are only four murders outside of that loop. The northern half of the city within 465 also has relatively few murders.

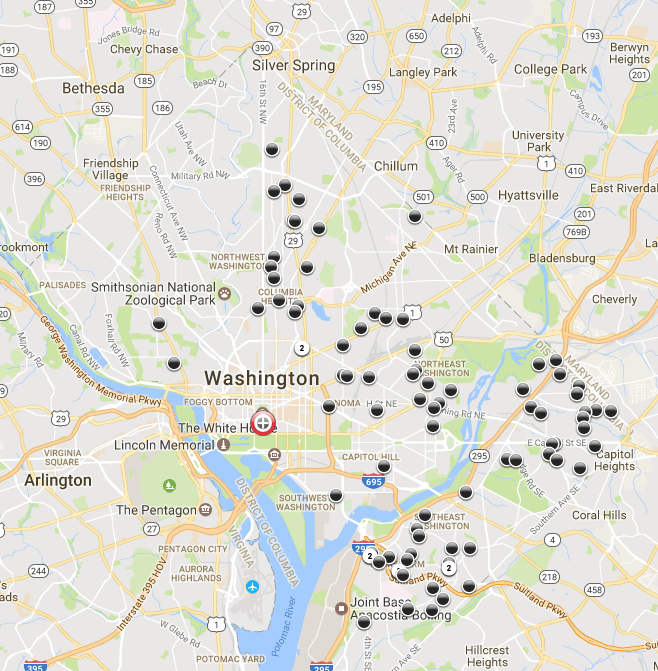
Washington, DC has large areas without murders. 14th Street NW divides the eastern and western parts of the district, with murders overwhelmingly limited to the eastern half. The area around the capitol is also extremely safe.
Here is the murder map for Dallas.

Here are Chicago’s murders through the first 4.5 months of 2017 (there were 222 homicides by that point). One small neighborhood, Austin, accounts over 25 murders. But 23 of the 77 neighborhoods in the city have zero murders, and most of the 40 neighborhoods in orange have only one murder. Twelve of the neighborhoods have 10 or more murders.

In a study in the journal Criminology, David L. Weisburd has a paper titled “The law of crime concentration and the criminology of place” that shows for eight cities 25% of violent crime occurred on one percent of the streets and that about half occurred on five percent of the streets.
Gun Ownership
According to a 2013 PEW Research Center survey, the household gun ownership rate in rural areas was 2.11 times greater than in urban areas (“Why Own a Gun? Protection is Now Top Reason,” PEW Research Center, March 12, 2013). Suburban households are 28.6% more likely to own guns than urban households. Despite lower gun ownership, urban areas experience much higher murder rates. One should not put much weight on this purely “cross-sectional” evidence over one point in time and many factors determine murder rates, but it is still interesting to note that so much of the country has both very high gun ownership rates and zero murders.
Conclusion
This study shows how murders in the United States are heavily concentrated in very small areas. Few appreciate how much of the US has no murders each year. Murder isn’t a nationwide problem. It’s a problem in a very small set of urban areas, and any solution must reduce those murders.
Data
The number of murders for each county Excel file_2014 For the column FIPS_CTY, 777 is for Tribal Agencies’ data and 999 is State Police data. The data is originally from the FBI UCR and is available from the University of Michigan’s ICPSR. What the county and state codes number correspond to are provided here.
While we have been unable to locate a copy of his research, Robert Muggah (Igarapé Institute) says “that 99% of violence in the USA is concentrated in 5% of street addresses.“


No comments:
Post a Comment